Overview
Dashboards provide a crucial way to configure unique views without the need for changes to the solution workflow.
Dashboards deliver an at-a-glance view into the relevant goals, metrics, initiatives, etc., being tracked in your Shibumi solution. The Dashboards page is a centralized location in which all Dashboards are held and created for an Enterprise. Dashboards are organized based on the App in which they are created. They can be marked and Public or Private and can be assigned Tags to help with organization.
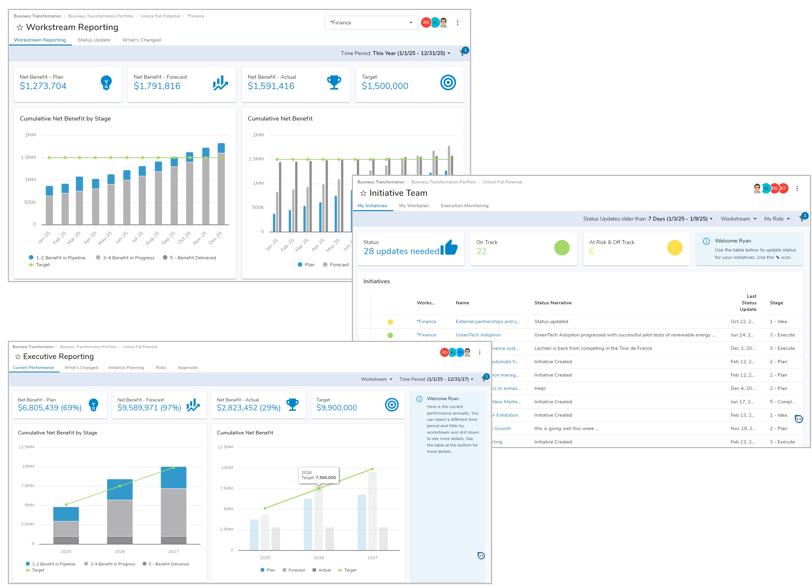
A few key points about Dashboards:
- They are context-based, meaning that the data being pulled into a dashboard is pulled from instances of the template type selected (Workstream, Initiative, Milestone, etc.).
- They can be configured to provide a summary of key program metrics and information.
- They can be configured to provide a personal summary of critical content.
- They are often defined to become the enterprise or personal homepage for users.
- They support hotkeys, allowing easy switching between edit modes:
- Display – q
- Configure – w
Navigating Dashboards
The Dashboards page, accessible via the Navigation Sidebar, holds all Dashboards for an Enterprise. The Dashboards visible to you on the page are based on a few aspects:
- Whether you have access to instances of the context type of a public dashboard
- Whether you have been added to a private dashboard
If you have access to multiple Apps, use the App selector to toggle between Apps. Filter between All Dashboards for an App visible to you, or “My Dashboards”: just the ones you have created. Search for a specific Dashboard by name or by tag.

The Dashboard page is broken down into multiple columns containing information on each Dashboard:
- Name: the name of the Dashboard itself. Each Dashboard will either have a Lock icon or not, this indicates whether a Dashboard is Public or Private.
- Context: the context which was selected for the Dashboard and where it pulls the information from (Initiative, Workstream, etc.).
- Creator: the initial creator of the Dashboard.
- Date Viewed: the last date on which you viewed the Dashboard.
- Actions: Add and edit Tags for the Dashboard.
Context
One of the big benefits of dashboards is that users can create a single dashboard and then view that dashboard for each instance of a certain template. For example, a region-level dashboard could be designed once, then viewed for each region individually. The current item the dashboard is presenting is called the “context” item. When a user is looking at a dashboard, they can use the dropdown in the upper-right corner of the screen to change the context item they are viewing. Any item the current user has visibility to can be chosen.
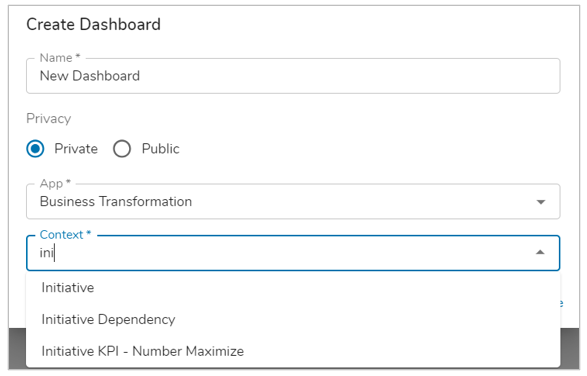
Each dashboard requires the user to choose what type of context item it will support when the dashboard is created; this determines what sections, fields, columns, etc. are available to be added to the dashboard.
On a Dashboard, the dropdown on the top right defines which work item Context is currently being displayed. Use this dropdown to change the source of section data.
Public vs. Private Privacy Setting
Dashboard privacy can be set upon creation of a dashboard. Depending on App Security settings, the ability to to change the privacy of a Dashboard is determined based on ‘All Users’ or ‘App Admins’. If set to ‘All Users’, the creator of the dashboard or any user with Admin access rights on the dashboard can access the Dashboards Settings dialog and modify the privacy setting. If set to ‘Add Admins’ then only App Admins can change the privacy of any Dashboard.
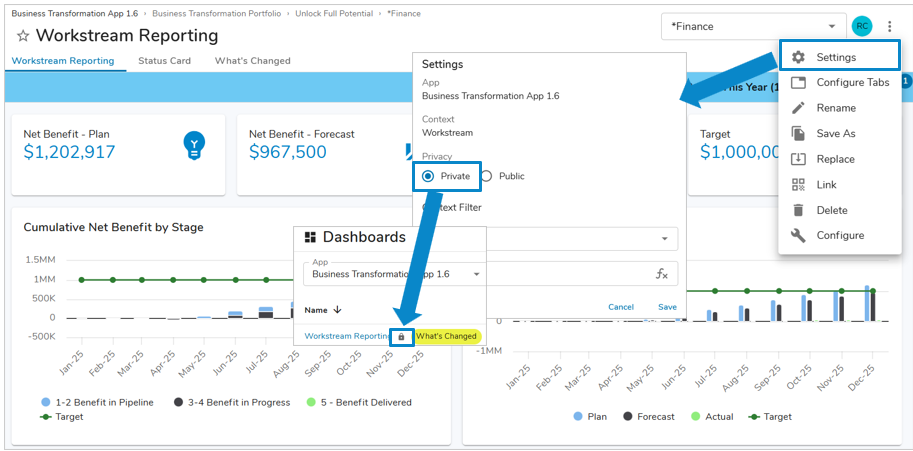
- Public: Visible to all users within the solution who have permissions on an instance of the Context Type.
- Private: Only visible to users holding a role on the Dashboard itself. Indicated via a ‘Lock’ icon next to the Name of the Dashboard on the Dashboard Central page.
If a user is given a role on a Dashboard but does not have access to an instance of the Context Type, they will not see any content within the Dashboard. Assigning a user a role on a Dashboard will not give them access to any data they cannot already see within the solution.
Tags
Tags on Dashboards allow for easy categorization and coordination on Dashboards, further enabling our reporting capabilities by providing visual indicators to users to know which Dashboards to access at-a-glance.
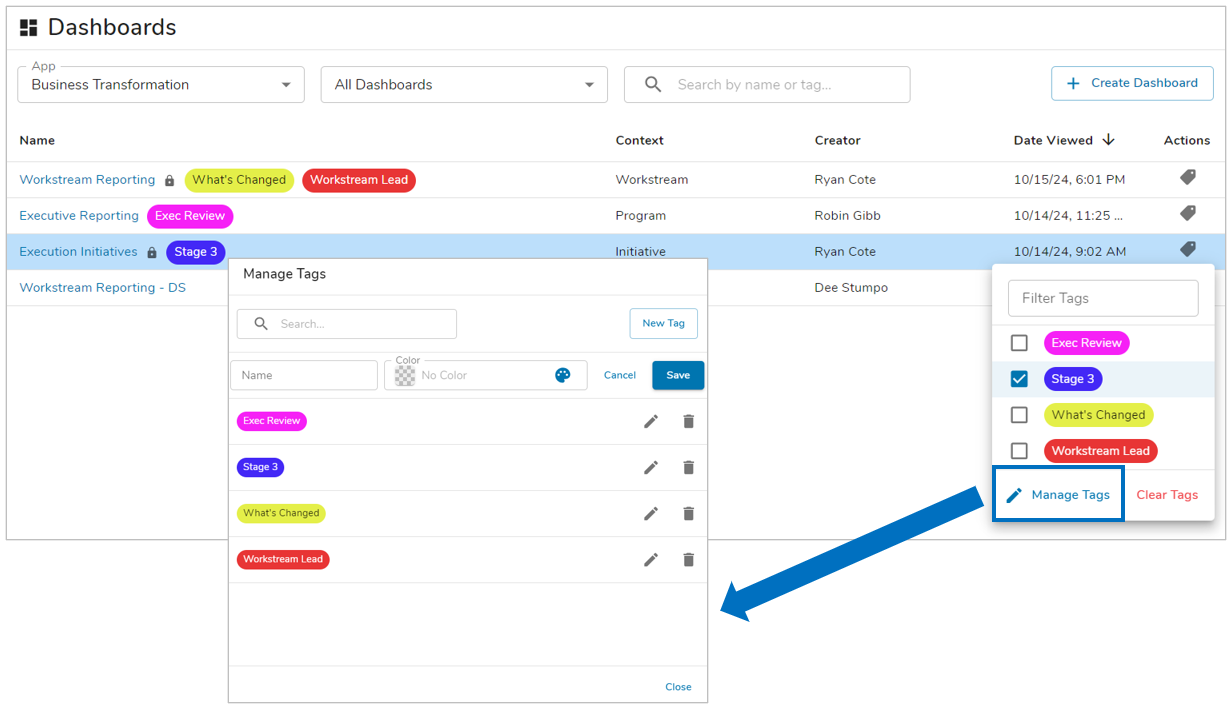
Tags are accessible from the Actions menu on each Dashboard within the Dashboards page. Selecting the ‘Tag’ icon will provide a list of current tags that have been created. Select tags to add or remove them from a Dashboard. The tag list can be filtered via the search bar at the top of the dialog. Additionally, all tags can be cleared from a Dashboard by selecting the ‘Clear Tags’ option.
To create new Tags for use within an App, select the ‘Manage Tags’ option from the Actions dialog on the Dashboards page.
From the Manage Tags dialog, new tags can be created, and existing tags can be edited/deleted. When creating a new tag, a Name and Color (via hex-code or color selector) must be defined.
Creating Dashboards
Creating new dashboards can be accomplished through several methods, including Sidebar Create, the main Dashboards page, the Save As Dashboard feature, or by utilizing the AI Create Dashboard capability.
App Admins have the ability to create new dashboards in Dashboard Central, with additional capabilities for importing and exporting dashboards. All users have the ability to create new dashboards using the Save As Dashboard feature or the AI Create Dashboard capability, provided this feature is enabled in their enterprise.
Create New
To create a new Dashboard, select the Dashboard option from the Sidebar Create menu or click the ‘+ Create Dashboard’ button on the Dashboards page. Follow the steps below to finish creating a new Dashboard:
- From the Create Dashboard dialog, fill in the Name field.
- Set the Privacy to either Public or Private (it is recommended to set Private for new Dashboards such that you can configure the dashboard before making it visible to others within your solution).
- Define which App the Dashboard will reside within and pull its data from.
- Finally, define the Context for the Dashboard. The options for the Context drop down will be provided from Templates within the previously selected App. Note: This cannot be changed post-creation.
- Click ‘Create’ to be brought to the newly created Dashboard.
Importing/Exporting Dashboards
App Admins have the ability to export Dashboards individually or as a collection within Dashboard Central. The exported Dashboard(s) can then be imported to another App or Enterprise, providing portability to a solution’s dashboard offerings.
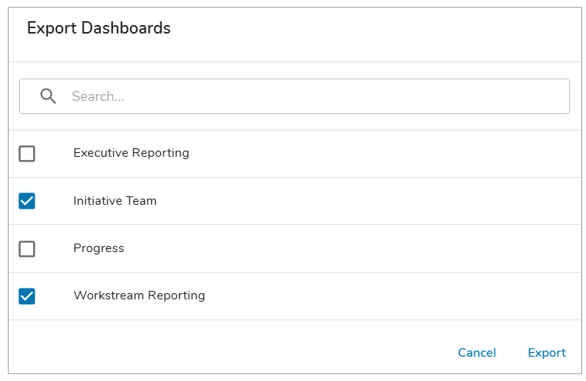
As an App Admin on the Dashboard Central page, select the More Actions ellipsis. Choose Export or Import.
- Export: Select one or more Dashboard(s) to be exported in a single file. App Admins can export any Dashboards they have access to (Private Dashboards they hold a role on or Public Dashboards they can view). The exported file will be created as: [App Name] Dashboards with a timestamp of when the export was initiated.
- Import: Choose a Dashboard file to import into the current App. Imported Dashboards will initially be set to Private, and the importer will be assigned as the Owner role of each. The context of any included dashboards must match a template that exists in the current App (the API name must match an existing template).

Save As Dashboard
With the Save As Dashboard feature, all users can instantly create a Dashboard using the existing layout of a Work Item. On save, any Page Filter values set by the user will become the new filter defaults on the Dashboard. The Dashboard can then be further configured, providing a streamlined process for configuring unique, persona-specific dashboards.
- On a Work Item, select the ‘More Actions’ icon in the top right of the page.
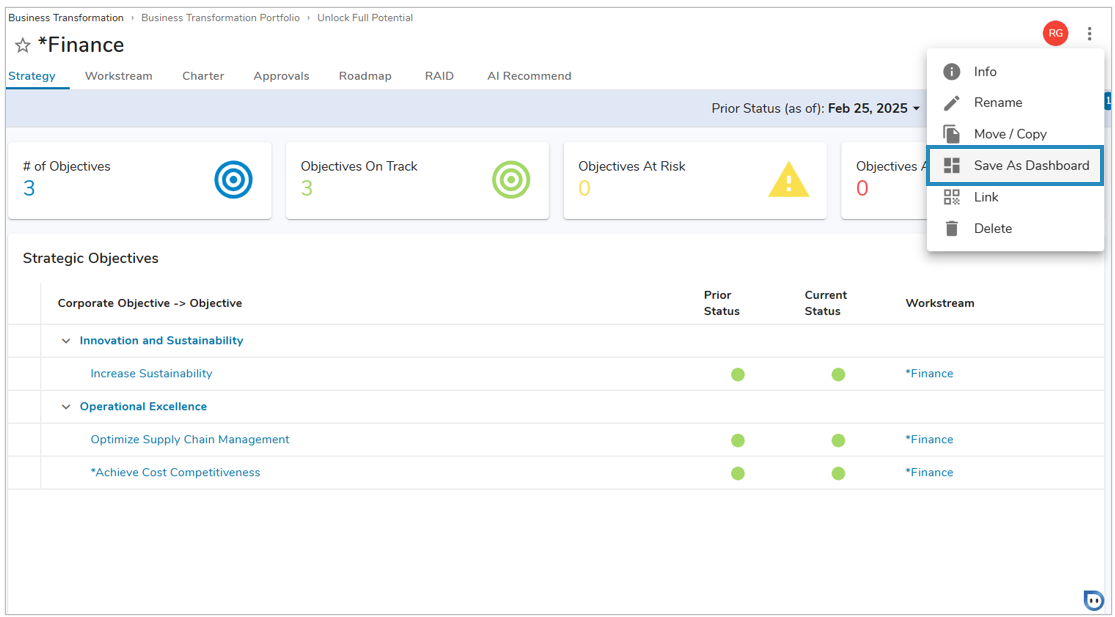
- Choose the ‘Save As Dashboard’ option from the drop down.
- The Save As Dashboard dialog will appear. From the dialog, define the Name, privacy setting, and select the available Tabs to be included from the Work Item. Tabs that are not available for inclusion will be grayed out and non-selectable.
- Tabs that include Views with ancestor columns or an ancestor context will be grayed out. Additionally, our out-of-the-box tabs (Metrics, Attachments, etc.) will be grayed out.
- Tab visibility expressions do not carry over to Dashboards.
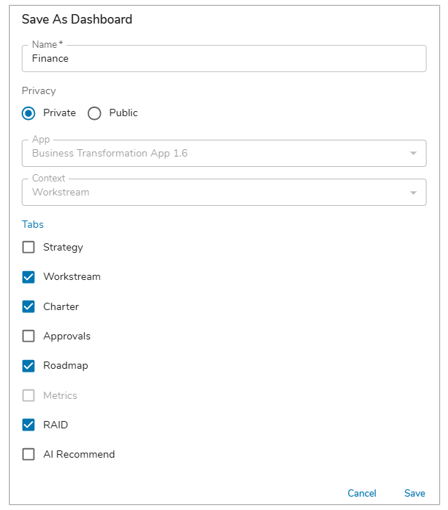
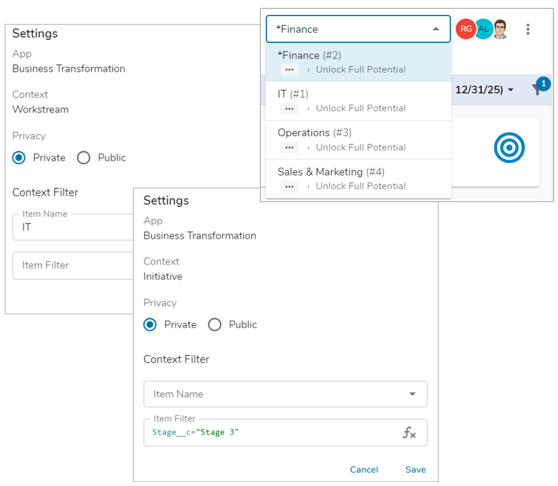
- Select ‘Save’ to create and view the new Dashboard. Upon creation, the Dashboard’s Context Filter will be set to the Work Item the Dashboard was created on. For example, in the below screenshot, the Context Filter is set to Finance.
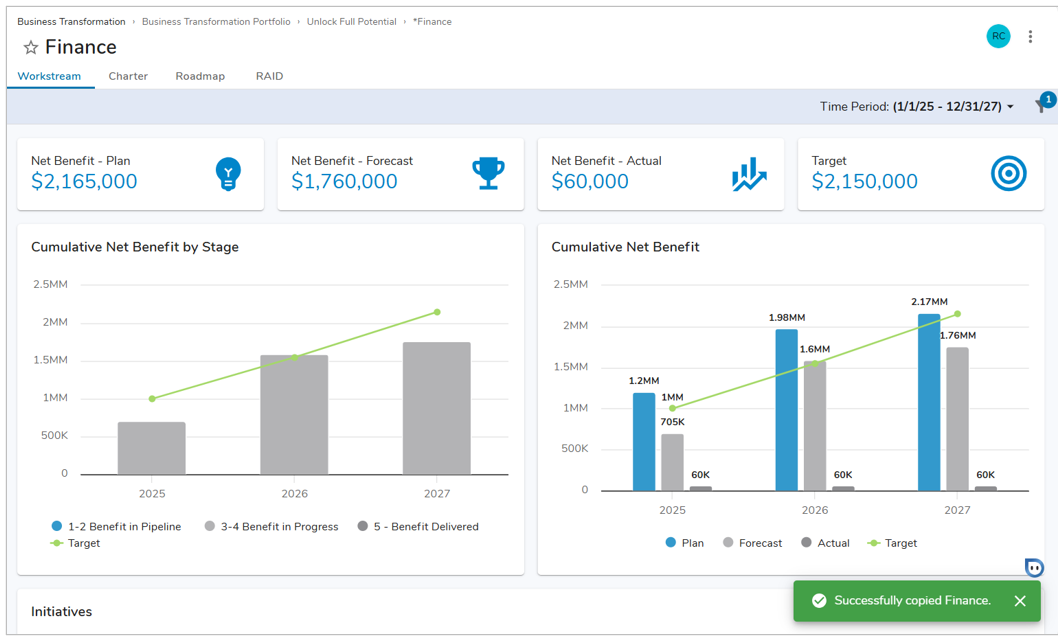
Notes:
- Visualizations not available in the Add Section dialog on Dashboard (Views, Gantt Chart, etc.) will be included in Dashboards via the Save As Dashboard feature. However, cannot be modified on the Dashboard itself and will be configured as-is from the Work Item.
- When using the Save As Dashboard feature on a work item which includes a List section, all List content will be removed. Additionally, Lists will not react to context changes via the Context Selector on the Dashboard. As a best practice, we recommend against including Lists on Dashboards.
Configuring Dashboards
General Layout
Access the ‘More Actions’ menu to configure a Dashboard. The options in the More Actions menu are as follows:
- Settings: Provides the general settings for the Dashboard such as the App, Context, Privacy and the Context Filter. For more information on the Context Filter please see the Settings section below.
- Configure Tabs: Dashboards can have multiple tabs configured to provide additional views of data. The Enabled Platforms can be defined for each.
- Rename: Rename the Dashboard.
- Copy: Provides the ability to Copy the current Dashboard as it currently exists. You have the option to define the newly copied dashboard’s privacy settings.
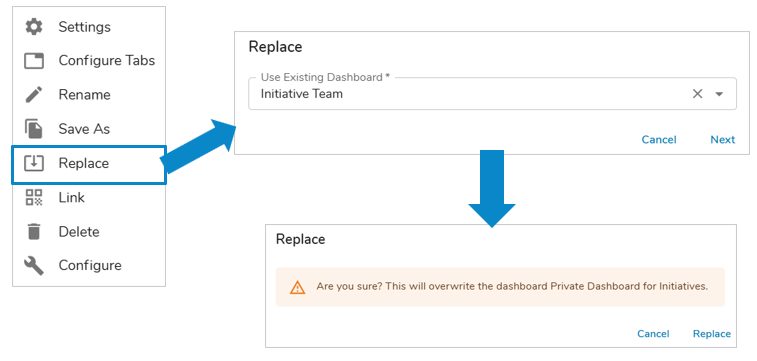
- Replace: Provides the ability to replace a Dashboard with another, immediately applying the Layout and Context Filter configuration from another Dashboard to the current.
- Link: Provides a Link to the Dashboard via QR code or Hyperlink.
- Delete: The only location in which the Dashboard can be deleted, confirmation for deletion will be required.
- Configure/Finish Configuring: Depending on the current state, either begin or finish configuring the Dashboard.
Sections Overview
Sections are the building blocks for a layout. They are the place where items can be created, viewed, and edited. Add sections to a Dashboard or configure existing sections by clicking Configure in the Actions menu. The following sections can be added via the Add Section dialog to Dashboards:
- Table: display work items (i.e., instances of a template) or associations. Tables can be configured to include editing of data or creation of new work items.
- Export / Import: download an Excel file of child items and upload the edited file to make updates
- Create Form: creation of work items via a form
- Edit Form: display and edit fields on the current work item
- Card: high level insight into data within your solution
- Chart: display a dynamic, graphical representation of a defined value from within your solution
- Board: drag-and-drop items across columns to visualize and manage your work
- Alert: display dynamic alert content to convey important information
- Rich Text: display static, read-only text
- Image: attach an image to be displayed in the section
Settings
Within the Settings dialog for a Dashboard, in addition to modifying the Privacy, you have the ability to define a Context Filter for the Dashboard. This will filter the list of work items visible in the context dropdown in the upper-right corner of the Dashboard.
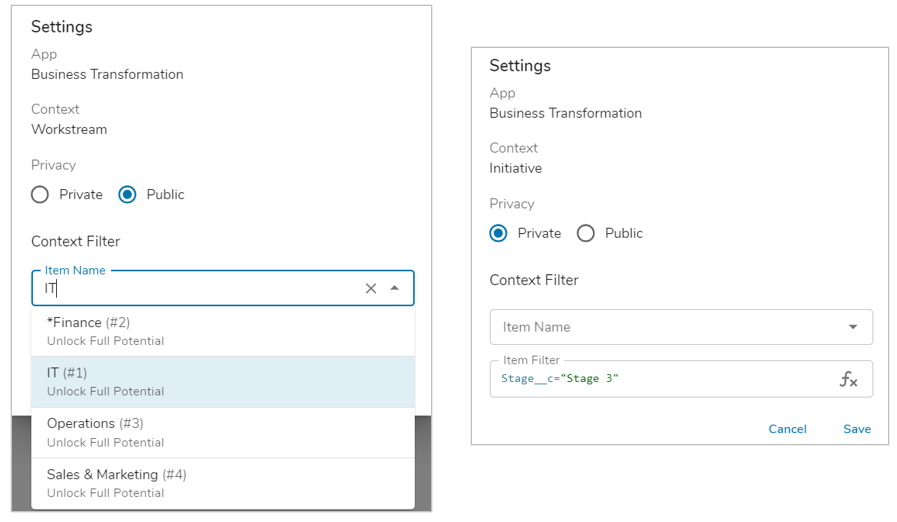
When filtering the Context of a Dashboard, there are two approaches:
- Item Name: This field is used to define a single work item for the context, selected from the defined Context Type. By defining a Context Filter, the Context drop down on the Dashboard will be removed and all data displayed will be limited to the defined work item.
- Item Filter: This field is used to enter an expression using the Shibumi Expression Language to filter the work item’s available for selection from the Context drop down. E.g., Stage__c = “Executed” would list the Initiatives which are in the Executed stage as available for Context selection.
Tabs
Dashboards can have any number of Tabs created for them, allowing for the configuration of multiple views of data within a single location. To add additional Tabs to a Dashboard, click the Actions Menu and select the Configure Tabs option.
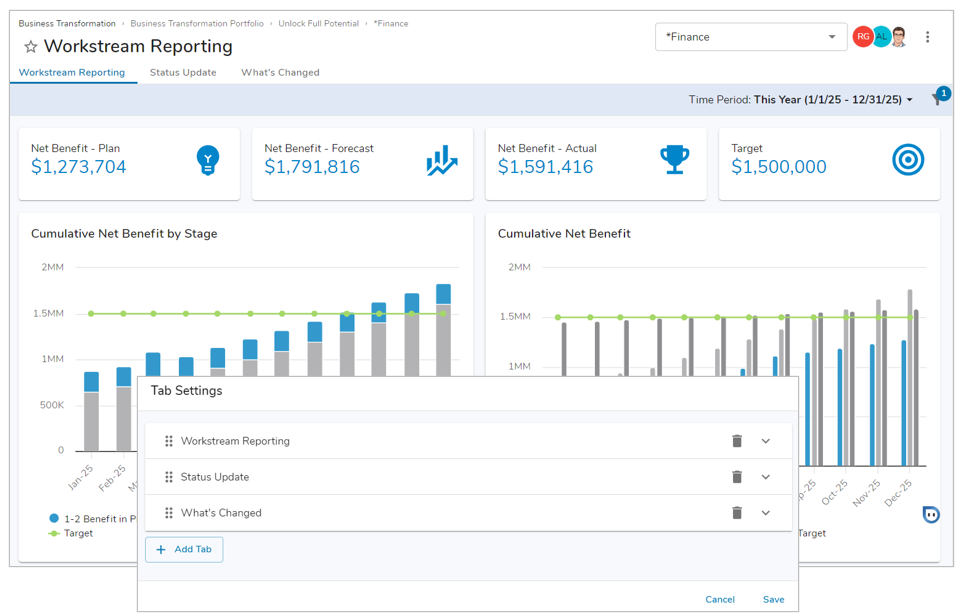
- From the Tab Settings dialog, select the ‘+ Add Tab’ button.
- Provide a Name and define the Enabled Platforms for the Tab.
- Desktop and Mobile: Tab appears on desktop and mobile devices. Layouts will snap into mobile-mode when on a mobile device, or if window screen is shrunk within mobile dimension criteria, stacking sections and Form fields vertically.
- Desktop: Tab will only display on desktop devices.
- Mobile: Tab only appears on mobile devices. Sections do not adjust; layouts will appear exactly as configured on the template.
- None: Tab will not display on desktop or mobile devices, rendering it hidden at all times.
- Add additional Tabs if necessary. Save.
- Configure each Tab as desired to provide unique views of data on each.
Notes:
- When there is only one Tab on a Dashboard, the Tab bar will not appear below the Dashboard name.
- Visibility expressions are not available for Tabs on Dashboards.
Replacing a Dashboard
By using the ‘Replace’ option, App Admins have the ability to immediately update the layouts of a Dashboard without interrupting other users that may be consuming the Dashboard throughout the day.
Follow the steps outlined below to Replace a Dashboard:
- Make a Copy of the Dashboard you would like to update, set the Privacy to ‘Private’ to ensure configuration is not visible nor disrupted.
- On the copied Dashboard, make the necessary changes to the Layout and Context Filters as desired.
- Once complete, navigate back to the original public Dashboard. Open the More Actions menu.
- Select ‘Replace’ and choose the previously copied/configured Dashboard from the drop-down menu. Select Next. Confirm the change by selecting Replace.
- Now you have updated a public Dashboard without any lapse of access for those utilizing the Dashboard! The participant list, privacy setting, and dashboard URL will not be impacted by the update.
