
Overview
Metrics measure results, identify historical trends, and help predict future success. They can track Numeric, Date or Text values, contain a collection of data sets (e.g., Actual, Target, Forecast) over an array of time periods (e.g., days, months, years). An expression can be defined for a data set and will be resolved to assign the values that are applied to the time periods, or users can manually enter values for the metric.
Creating a Numeric Metric
To add a new Numeric Metric:
- On a Template Data Panel, click Create Attribute and select Metric.
 Enter a Name for the new Metric. The API Name will be auto-generated based on your input. Ensure Type is set to Numeric.
- Choose the Unit of Measure for the Metric (defines what you’re tracking) by selecting an option from one of the categories: numeric, currency and time.
- Select the Period of Measure to define the cadence that data is being calculated and captured for the Metric. The options are as follows:
- as of Date: A point-in-time value that reflects the current value as of a specific date – ideal for metrics like Headcount that aren’t aggregated over time. When a value is entered for a given date, that value persists across all future timeframes until a new value is provided.
- The defined cadence options (per Year, Per Quarter, Per Month, and per Day) track data on their specific cadence and allow aggregations to less-granular frequencies (i.e., Daily can be aggregated to any other frequency, Monthly can be aggregated Quarterly or Yearly, etc.).
- Select the Target Direction for the new Metric: Maximize, Minimize or Maintain.
- Maximize: higher value = good
- Minimize: lower value = good
- Maintain: value within a range = good
- Define a description for the Metric which will be visible to App Admins.
- Define whether the Metric will be visible to Admins Only.
- Click Next. Optionally, define calculations or editability rules for each metric data set.
- Click Create. Your new Metric will be visible in the Data Panel.
Creating a Date Metric
To add a new Date Metric:
- On a Template Data Panel, click Create Attribute and select Metric.
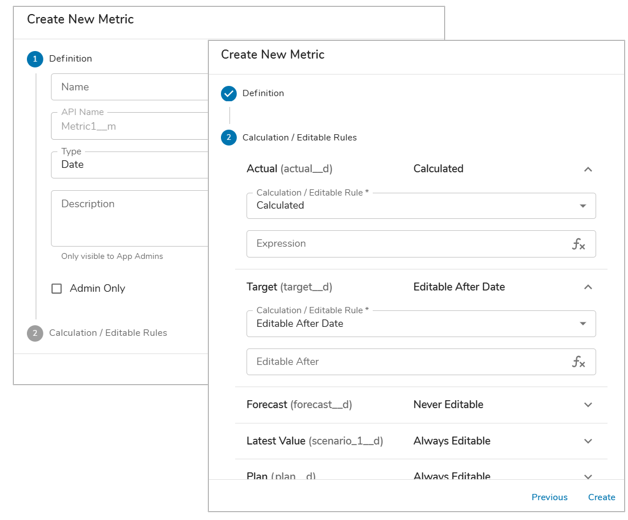
- Enter a Name for the new Metric. The API Name will be auto-generated based on your input. Ensure Type is set to Date. Note: For Date metric types, the Period of Measure is always an ‘as of Date’ cadence.
- Define a description for the Metric which will be visible to App Admins.
- Define whether the Metric will be visible to Admins Only.
- Click Next. Optionally, define calculations or editability rules for each metric data set.
- Click Create. Your new Metric will be visible in the Data Panel.
Creating a Text Metric
To add a new Date Metric:
- On a Template Data Panel, click Create Attribute and select Metric.

- Enter a Name for the new Metric. The API Name will be auto-generated based on your input. Ensure Type is set to Text. Note: For Text metric types, the Period of Measure is always an ‘as of Date’ cadence.
- Define the Format of the Text Metric (Single Line, Multi Line) and the Max Length.
- Define a description for the Metric which will be visible to App Admins.
- Define whether the Metric will be visible to Admins Only.
- Click Next. Optionally, define calculations or editability rules for each metric data set.
- Click Create. Your new Metric will be visible in the Data Panel.
Configuring Metrics from the Data Panel
On a template Data Panel, in the Attributes tab, click on the Metrics icon to filter out all other attribute types. Select the pencil icon in the Actions column of a Metric to open the metric settings dialog.
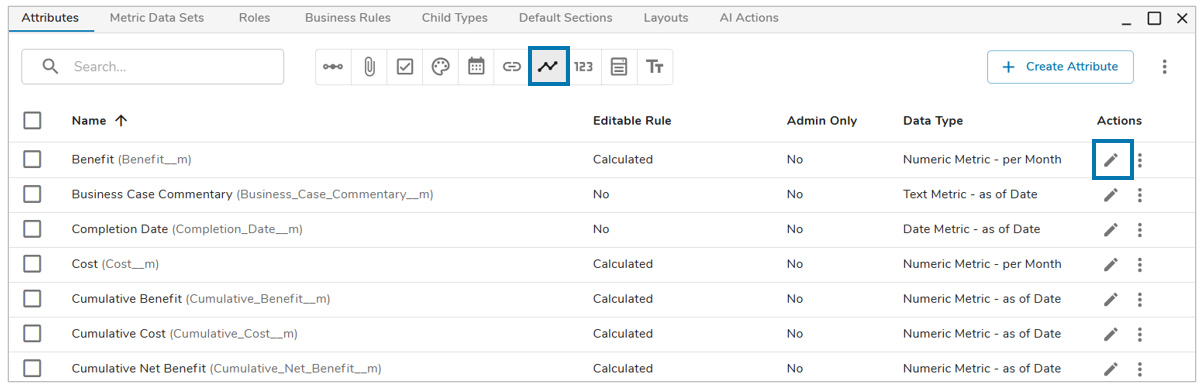
Metrics can be copied to other templates. Select one or more metrics, then click the more actions ellipsis and select “Copy to.”
General Tab
On the General tab, you can edit the details of the specified Metric attribute.
Numeric
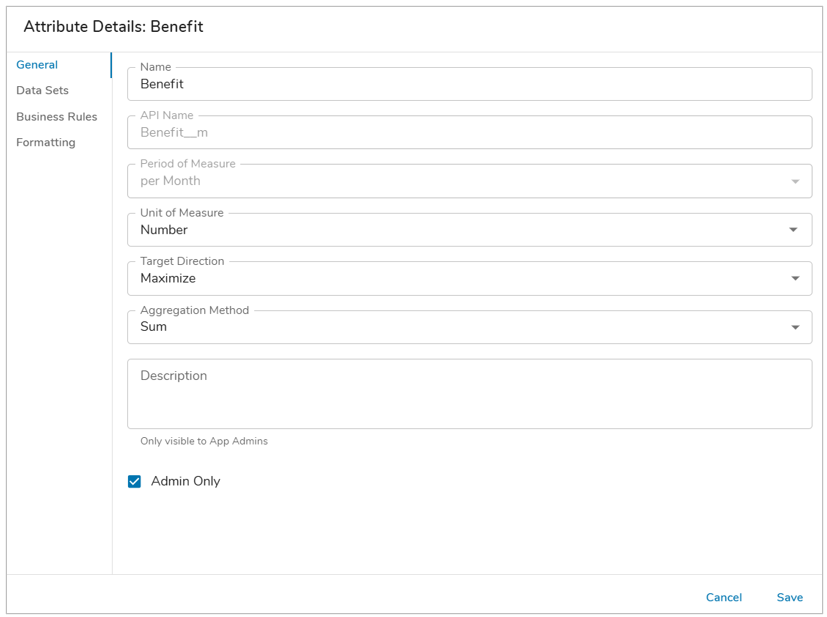 Name / API Name: the Name can be edited, but the API Name cannot be edited because if the metric is being referenced in expressions, the expressions would not update with the new API name.
- Period of Measure: cannot be edited after metric creation.
- Unit of Measure / Target Direction: can be modified at any time.
- Aggregation Method: will be assigned to Sum by default. However, you can choose to change it to one of the other options: Average, Minimum, or Maximum. This setting drives the method of aggregation when displaying a daily metric per month, or a monthly metric per year, etc.
- Description: a text description covering the purpose of the Metric, only visible to App Admins.
- Admin Only: determines whether the Metric will only be visible to Admins when configuring sections on Dashboards, Layouts, or Presentations.
Date
- Name / API Name: the Name can be edited, but the API Name cannot be edited because if the metric is being referenced in expressions, the expressions would not update with the new API name.

- Period of Measure: cannot be edited after metric creation.
- Description: a text description covering the purpose of the Metric, only visible to App Admins.
- Admin Only: determines whether the Metric will only be visible to Admins when configuring sections on Dashboards, Layouts, or Presentations.
Text
- Name / API Name: the Name can be edited, but the API Name cannot be edited because if the metric is being referenced in expressions, the expressions would not update with the new API name.
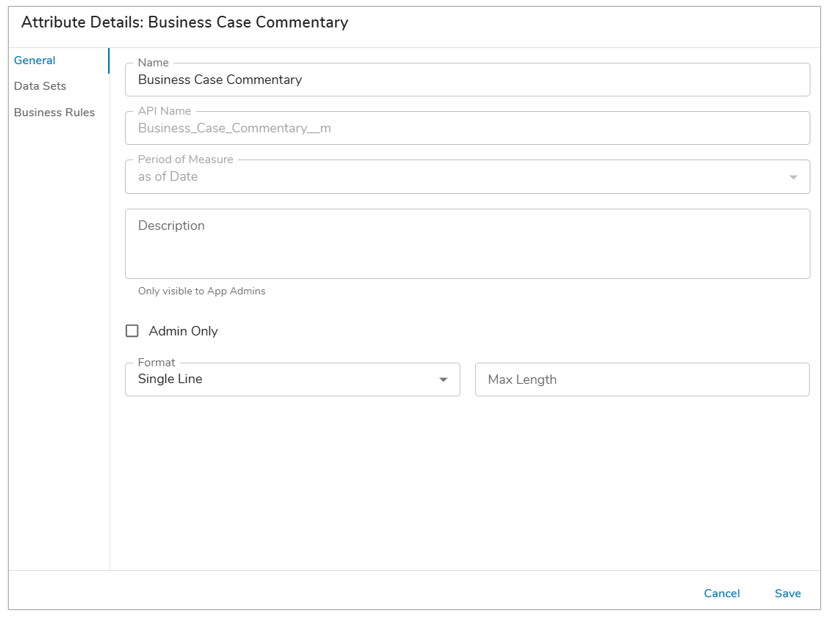
- Period of Measure: cannot be edited after metric creation.
- Admin Only: determines whether the Metric will only be visible to Admins when configuring sections on Dashboards, Layouts, or Presentations.
- Description: a text description covering the purpose of the Metric, only visible to App Admins.
- Format: defines whether the Metric will be single line or multi line when displayed on Forms and Tables. Optionally, the Max Length of enterable text can be defined.
Data Sets Tab
- On the Data Sets tab, you can edit the calculation or configure editability rules for each data set (available data sets are any enabled at the App-level).
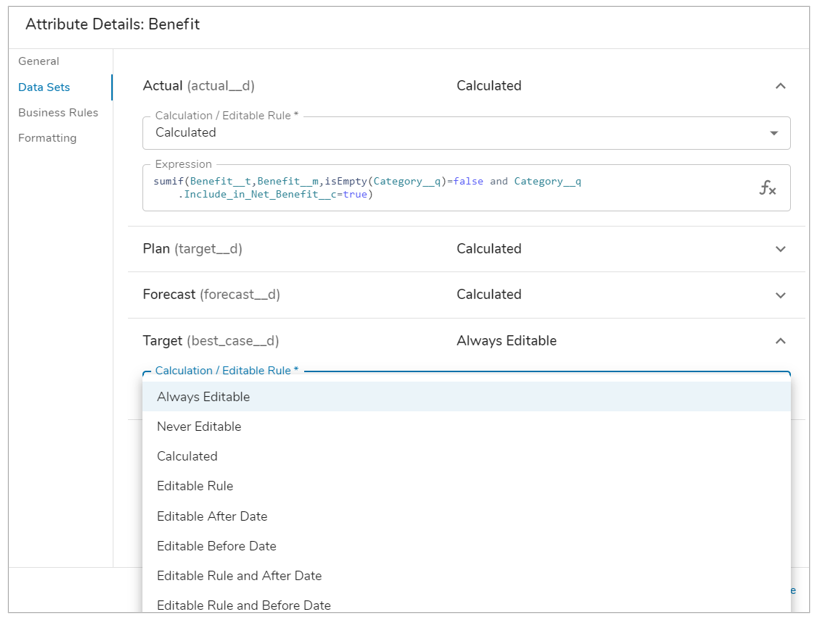
- By Default, data sets will be set to Always Editable. Open the drop-down menu to select a different option. Depending on the option selected there will be fields to fill in before saving:
- Always Editable: End users can manually input metric values on instances of the template.
- Never Editable: End users cannot add values to the metric.
- Calculated: Add an expression that calculates the value of the metric.
- Editable Rule: Add an expression that dictates in what conditions a metric can be manually edited.
- Editable After Date: Add an expression that resolves to a date after which the metric can be manually edited.
- Editable Before Date: Add an expression that resolves to a date before which the metric can be manually edited.
- Editable Rule and After Date: Add an expression that dictates in what conditions the metric can be edited and an expression that resolves to the date after which the metric can be edited.
- Editable Rule and Before Date: Add an expression that dictates in what conditions the metric can be edited and an expression that resolves to the date before which the metric can be edited.
Note:
- Editability rules for metric data sets can also be set on the Data Sets tab of the Data Panel. When a Data Set has an editability condition set, it will apply to all metrics created on the template and will override any editability conditions set on a specific metric’s data set (unless the metric has a calculation expression). See Metric Data Set & Time Period Editability for more information.
Business Rules Tab
On the Business Rules tab, you can view the Business Rules that are configured to run for each of the Data Sets. 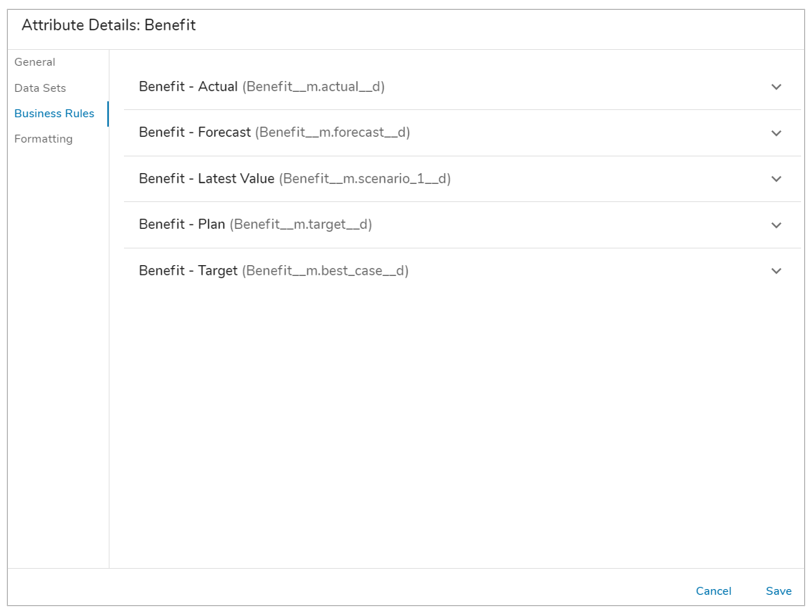
Formatting Tab (Numeric Only)
Only found on the Settings dialog for Numeric Metrics. On the Formatting tab, you can configure conditional formatting for each data set. This will define the background color of a metric cell depending on its value compared to another data set’s value.
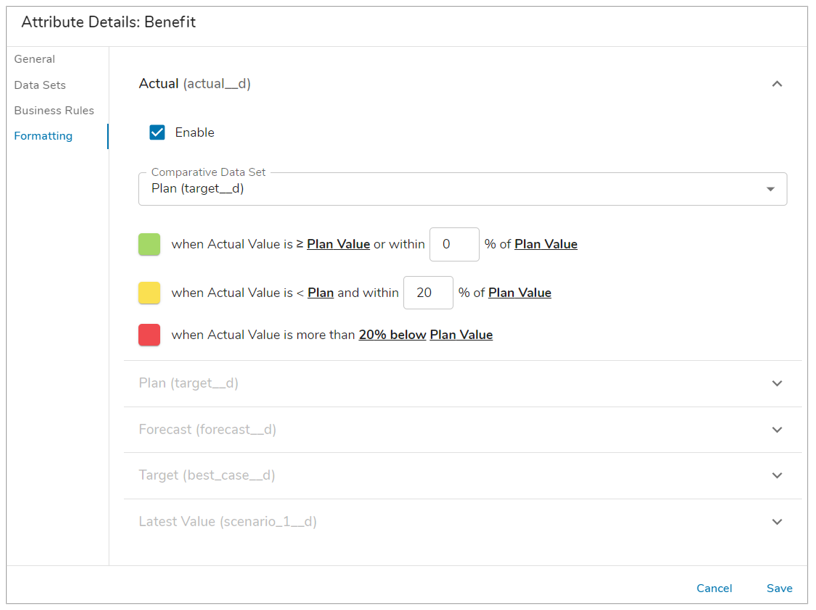 Click on a data set row to open the formatting information for that specific data set.
- Enable or Disable whether conditional formatting will be displayed for the Data Set.
- Select the Comparative Data Set.
- Edit the percentage threshold to define the range in which the Success and Warning colors will appear. The Error percent will automatically be define based on the Warning threshold setting.
- Save. Publish.
Notes:
- The colors are directly drawn from the Enterprise’s Success, Warning and Error color selections on the Branding tab.
- Metric conditional formatting appears for all data sets in Table sections. In Metric Lists/Views, formatting only appears for the Actual data set.