
The Color attribute is an out-of-the-box attribute that allows you to set a specific color for each work item in your solution. When these work items are included in Chart sections, they will use their defined Color to ensure those data series have consistent coloring in all Charts.
Setting the Color Attribute
The Color attribute (API name: color) will be present on all templates within the Data Panel. It can be added to any Form for editing:
- Add it to an Edit Form section to set it individually on each work item
- OR add it to a Table section with an Edit Form configured so you can quickly set it for all instances of the specified Type
From a Form’s Add Attributes dialog select the Color Attributes icon to find the out-of-the-box Color attribute.
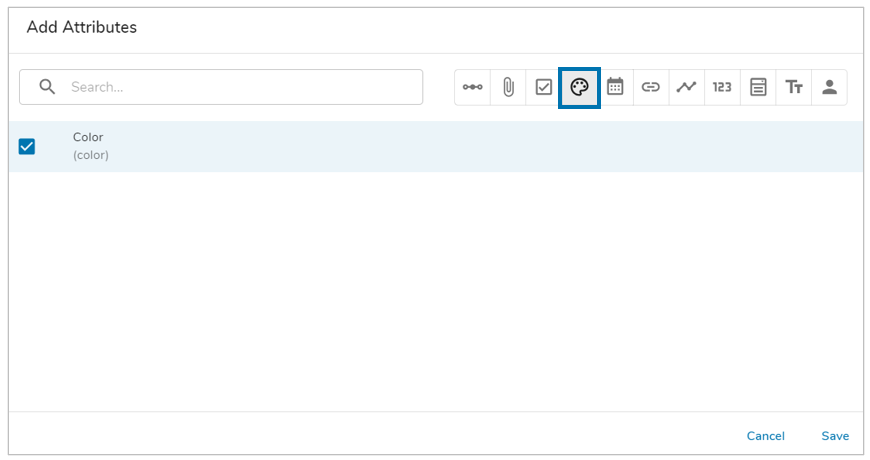
Edit the Color attribute by entering a hex code or selecting the palette icon, opening the Color Panel. Save any changes. 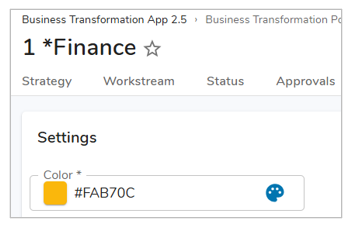
Using the Color Attribute in Charts
With a unique color defined for individual work items, you can now leverage these colors within the Chart section. 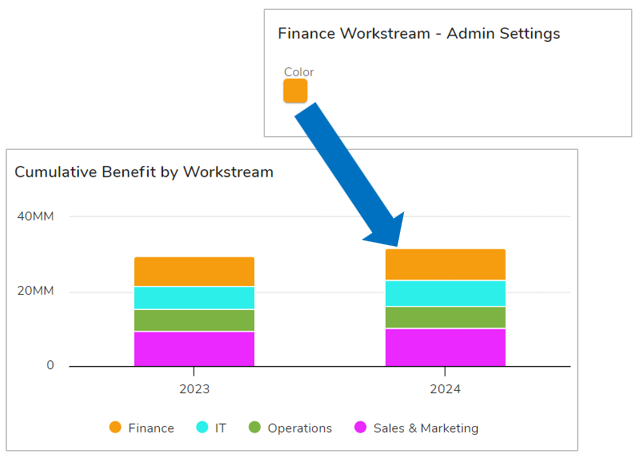
When configuring a Metric Timeframe Chart with the Stacked Chart display option, selecting Item Name or Association for the Slice By field will result in the out-of-the-box Color attribute being used for the defined work items.
For more information on configuring the Chart section, please visit our Support Site article.