
The Table section is an extremely performant display of Data Sets. Tables can be configured to include editing of data or creation of new work items.
Tables will be paginated when they’re set to Fixed Height and will have virtual scrolling when they’re Fit to Window (default), more information on these settings can be found in the Height Settings article.
Adding a Table
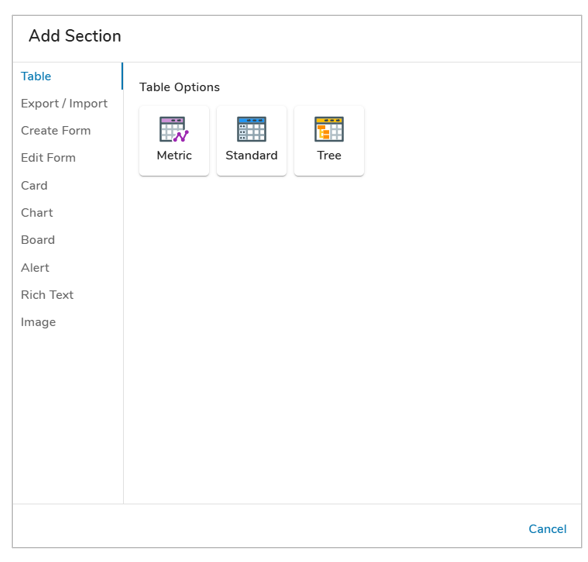
- On a layout in Configure mode, open the Add Section dialog.
- Select the Table option from the left panel.
- Click on the Metric icon to define the content to be displayed in the Data Set Table section. The Table will be added to the layout.
Configuring Metric Table Settings
After successfully creating a new Table Section, follow the steps below to fully configure your new Table. These configuration options can be edited on an existing Table Section via the Settings dialog while in Configure mode on a Layout.
General Tab
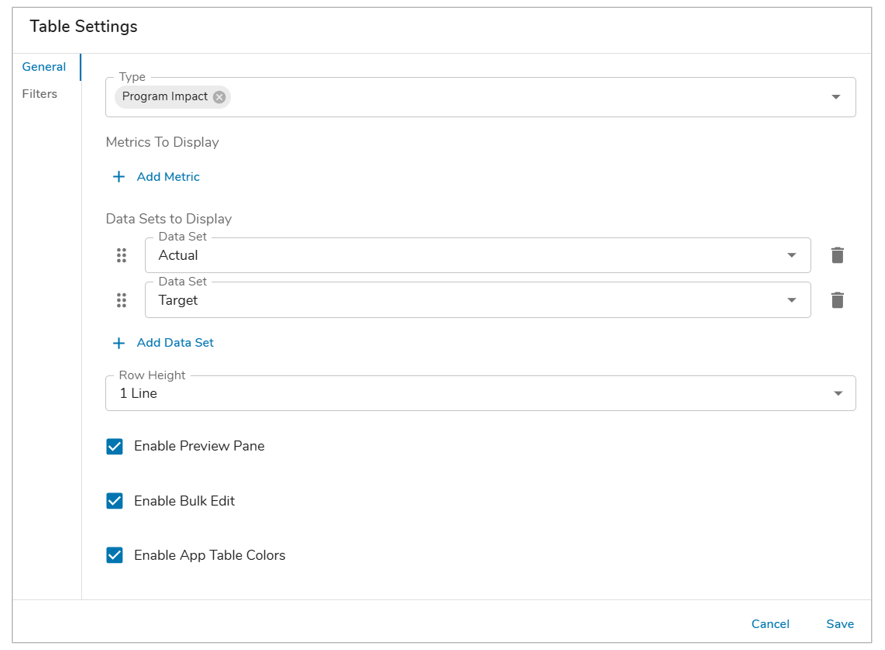
- Click on the Settings icon (gear) from the Section Controls of the Table.
- Click on the Types drop down menu to see all available templates. Select one or more templates or associations to define where to pull the metric data from.
- Select the ‘+ Add Metric’ button. Choose a metric from the drop down, select the button again to configure additional metrics to display as rows. Note: If multiple template types are selected, only metrics available on both templates will be available.
- Define one or multiple Data Sets to display under each of the selected Metrics, by default the Actual and Plan Data Sets will be enabled. Remove or reorder the Data Sets as desired.
- Optionally, determine the Row Height, and whether the Preview Pane and/or Bulk Edit functionality is available on the Metric Table.
- (Optional) Enable App Table Colors for the Table. The columns will have their respective colors applied from those configured on the App Colors page. For more information regarding Table Colors, please review the Configuring App Colors article.
Filters Tab
Locked filters can be set when configuring a Table. These filters will apply to all content in the Table and cannot be seen or edited by end users viewing the Table.
Ex: {!toFilter(today())}, {!toFilter(Program__t.Start_Date__c)}
Additionally, Page filters can be set using the injected expression syntax: {!toFilter(API_Name__f)}. Refer to the Page Filtering article for more details on configuration.
- Navigate to the Filters tab in the Table settings dialog.
- Choose the attribute on which to filter from the drop-down menu.
- Enter a value into the Value field. Filtering syntax can be found here.
- Add another filter by clicking Add Filter.
- Remove a filter by clicking the trash icon next to the filter.
Note: If “This” is the only source context, filters cannot be applied.
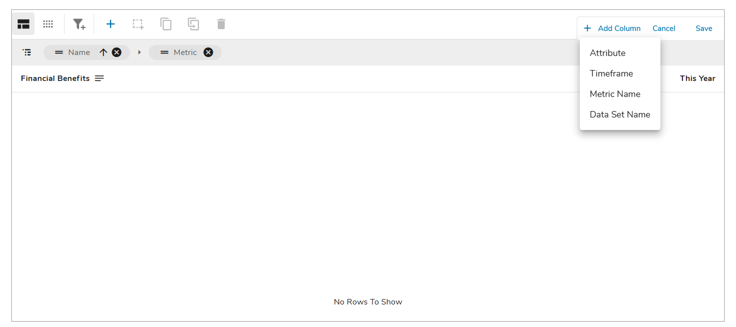
Metric Table Unique Columns
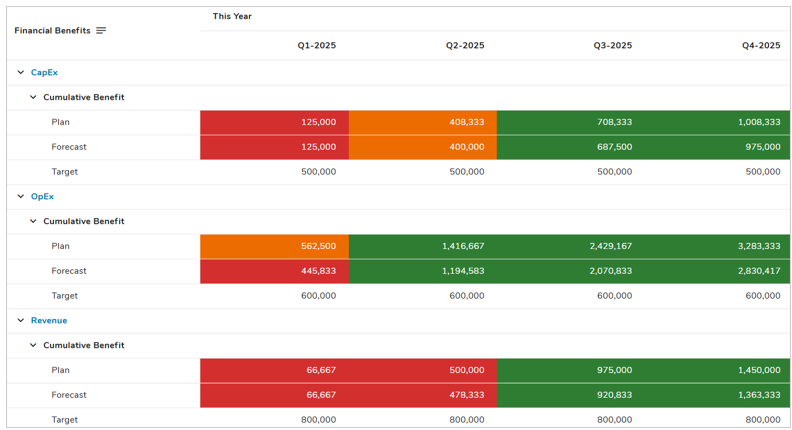
Metric Data Set Tables have two unique column types to provide flexibility in how data is displayed when configuring the section: Metric Name & Data Set Name.
Each of these column types will display their respective values depending on the Table configuration. For example,
- A Metric Table has the Cumulative Net Benefit and Estimated Benefit metric’s defined, for a Metric Name Column each of the names will be displayed as separate rows/values.
- A Metric Table has the Plan and Actual Data Sets defined, for a Data Set Name column each of the data set names will be displayed as separate rows/values.
Note: Calculated columns are not available on Metric Table sections. Metric Name & Data Set Name columns can be included in Grouped Headers.
For more information on configuring Columns in Table sections, please visit our Configuring Table Columns article.